
One of the primary goals of this project was to determine if a community-based groundwater monitoring network could be established using volunteer well owners. The collection of water level data by landowners would provide researchers with the information needed to develop scientific principles for modeling groundwater in the Paskapoo Aquifer. This research would increase the understanding of local groundwater processes, which could be used to make informed decisions on the sustainable development of water resources.
|
|
Study AreaRocky View County
Some of the highlights about Rocky View County are provided here, however for more extensive information; please visit their website. The geographic location of Rocky View County is in southern Alberta and surrounds the City of Calgary to the East, West, and North of the city limits. The County covers 53 townships and partial townships (as of the July 2006 census). The County shares its borders with six rural municipalities, two First Nation Reserves, one other city (Airdrie), four towns (Cochrane, Chestermere, Crossfields, and Irricana) and one village (Beiseker). In addition, there are fourteen hamlets included within the Rocky View County borders. Agriculture is a major land-use practice in Rocky View County. The agriculture profile in 2004 was crop production in the eastern two-thirds of the County, which centered on wheat, barley, canola and rye. The western third of the County is generally livestock production where green-feed and annual pastures are prevalent. In 2004 there were approximately 900 operations with 20+ head of cattle and a number of feedlots dispersed throughout the area. Oil and gas activities have increased since 1980, spreading from east to west, across approximately two-thirds of the County (REF). In addition, the development of commercial, industrial and residential areas has occurred, particularly during the most recent economic boom. Generally this development has been concentrated in growth areas identified by the County (REF). Climate The table below reports the approximate daily maximum, minimum and annual average temperature for Rocky View County, using information from the Calgary International Airport. These values are representative averages as the County encompasses a wide amount of land and varies in elevation. 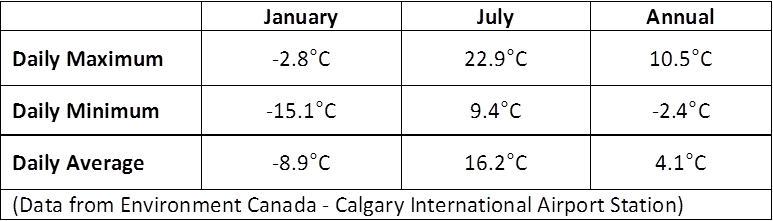
The average annual precipitation is reported below, along with the division of the amount of rainfall and snowfall in Rocky View County. The data is from Environment Canada and uses the Calgary International Airport Station. Finally the sunshine hours per year and the horticultural zone are provided.
Average Annual Precipitation = 413mm *Note: Precipitation is the water equivalent of all types of precipitation (Environment Canada) Average Annual Rainfall = 320.6mm Average Annual Snowfall = 127cm *Note: Snowfall is the measured depth of newly fallen snow, measured using a snow ruler. Sunshine: 2,295 hours per year (Source: Environment Canada 2001) Horticultural zones: Range from 2b to 3a (Source: Calgary Horticultural Society 2003) |
Geology
The Paskapoo Formation is one of the most important aquifers in Alberta, extending eastward from the foothills of the Rocky Mountains and extending north and south along the Edmonton-Calgary corridor. The Paskapoo is comprised of sandstone, siltstone and mudstone, which create a heterogenous formation. The physical properties of a geological formation determine its ability to store and transport groundwater (aquifer). The physical properties of an aquifer are high porosity (ability to store water) and high hydraulic conductivity (ability to transmit water). In the Paskapoo Formation the fractured sandstone units formed by ancient meandering river channels are the ideal groundwater source for domestic wells. The siltstone and mudstone within the Paskapoo have variable porosity and low hydraulic conductivity, which defines them as aquitards. Aquitards transmit water too slowly to be used as a groundwater source for domestic wells. 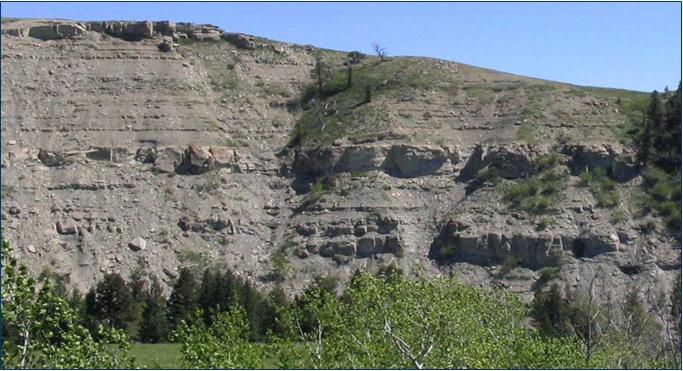
Research shows the Paskapoo is a series of ancient meandering river channels, which make it complex. Although the formational process has been determined as ancient fluvial systems, the size and location of the sandstone channels are difficult to locate. These sandstone channels are interwoven with deposits of siltstone and mudstone, which are less permeable formations. Since the Paskapoo is one of the largest aquifers in the Canadian Prairies, there has been increased interest from researchers to better understand and map the formation (Grasby et al., 2008). For more information, please download our Geology fact sheet. |
Changes in Groundwater ResearchResearchers, municipalities, and landowners want to understand the impact pumping has on their local groundwater system. This knowledge can be used to sustainably develop the aquifer ensuring water is available for future generations. Therefore, researchers are working towards understanding how to determine sustainable pumping rates for the hydrologic system as a whole instead of a single aquifer. Previous work in Kansas found streams were disappearing due to over pumping of groundwater. This observation has led to research focusing on finding solutions and preventative methods to ensure water is available for both the aquatic ecosystem and continual use by residents.
|
Groundwater ProcessesGroundwater research has
determined there is a naturally occurring water balance between recharge
(input) and discharge (output). The
average of input minus output over the long-term (10 to 20 years) is equal to approximately
zero and considered “steady state.”
Research has also found that the addition of pumping by humans alters
this water balance. The water balance
equation has additional water being subtracted from the recharge amount and the
equation is expressed as:
Recharge – Discharge – Pumping = Change in Storage The addition of pumping will change the steady state and the recharge minus discharge will no longer equal zero. The amount of pumping from the aquifer will determine whether a new sustainable water balance is achieved over the long term. However, if there are some areas where pumping is greater than recharge, streams and wells may run dry. For a more detailed explanation of the water balance and its components – check our Groundwater Storage fact sheet. Recharge – The current research has found recharge in the Canadian Prairies occurs through a depression-focused recharge process. During the winter and spring months, snow and snowmelt water accumulate in low lying bowl shaped depressions. As the ground thaws, water begins to infiltrate into the soil. The majority of the water is directed towards the plants surrounding the depression and growing in the upland areas; with a small proportion traveling deep enough to reach the water table. In Rocky View County the recorded precipitation is approximately 400mm a year, with only 0% to 10% of that total precipitation reaching the aquifer and recharging the groundwater. This minimal amount of recharge makes it critical to understand the recharge process. For more detailed information – check out the Groundwater Recharge fact sheet. Discharge – Natural discharge occurs at locations where groundwater flows into surface water features, such as springs or streams. Groundwater can discharge along the gravel channel bed of a stream, which regulates stream temperature and nutrients. In streams with this type of groundwater exchange, it is generally continuous along a section of the stream where the channel bed is located at the water table. In the West Nose Creek watershed, previous research has concluded discharge occurs mainly through springs, which contribute to baseflow in the creek. The location of springs is determined by the geology of the area, with the majority of local springs discharging from the Paskapoo sandstone formation. To learn more – check out the Groundwater Discharge fact sheet. Pumping – Researchers understand that pumping will impact the groundwater system. However, the cumulative impact of multiple wells pumping within an aquifer is not necessarily understood. This has caused a shift in research – from focusing on pumping tests that assume only one well is located in an aquifer; to a watershed-based approach focusing on the interaction of multiple wells and the groundwater-surface water interaction. Since the location and extent of individual aquifer units in the Paskapoo Formation (local aquifer system supplying most of groundwater) are not completely understood by researchers, it is difficult to fully understand the impact pumping could have on local water resources. |
Groundwater ModelingIn order to make predictions about how changes in land-use practices and climate will impact the water balance in Rocky View County, researchers use numeric models to simulate possible outcomes. Before a model can be used in making sustainable decisions about groundwater use, it must be calibrated first. The calibration determines if the model represents the observed changes occurring within a local area.
By using advanced software and mathematical techniques, groundwater modeling allows for researchers to incorporate a wide variety of different variables (e.g., climate, groundwater recharge, geology, groundwater pumping) that affect the water level elevation. This allows for researchers to simulate the impacts of different scenarios (e.g., a changing climate or increasing population) and aids in sustainable decision making. Water level data from the community-based monitoring network is used to verify the accuracy of our groundwater model (i.e.,how good is our model at predicting water levels). The model can then be used to simulate different scenarios to determine how they might impact the local aquifer water levels. |
Research PublicationsAdapted Primary Literature (Summaries of local groundwater research)
Groundwater Connections - Research in West Nose Creek Watershed Fact Sheets Geology Fact Sheet Groundwater Storage Fact Sheet Recharge Fact Sheet Discharge Fact Sheet Watershed Approach Fact Sheet Community Monitoring Fact Sheet Web Portal Fact Sheet For more information on local groundwater research, please refer to this Reference List for recommended publications. |
Research Pictures
|
|
|
Thank you to our Project Partners
|

|

|

|
